For the complete documentation index, see llms.txt. Markdown versions of all docs pages are available by appending .md to any docs URL.
Cost dashboard
View LLM spend, tokens, and traffic in the built-in Admin UI when running agentgateway on Kubernetes.
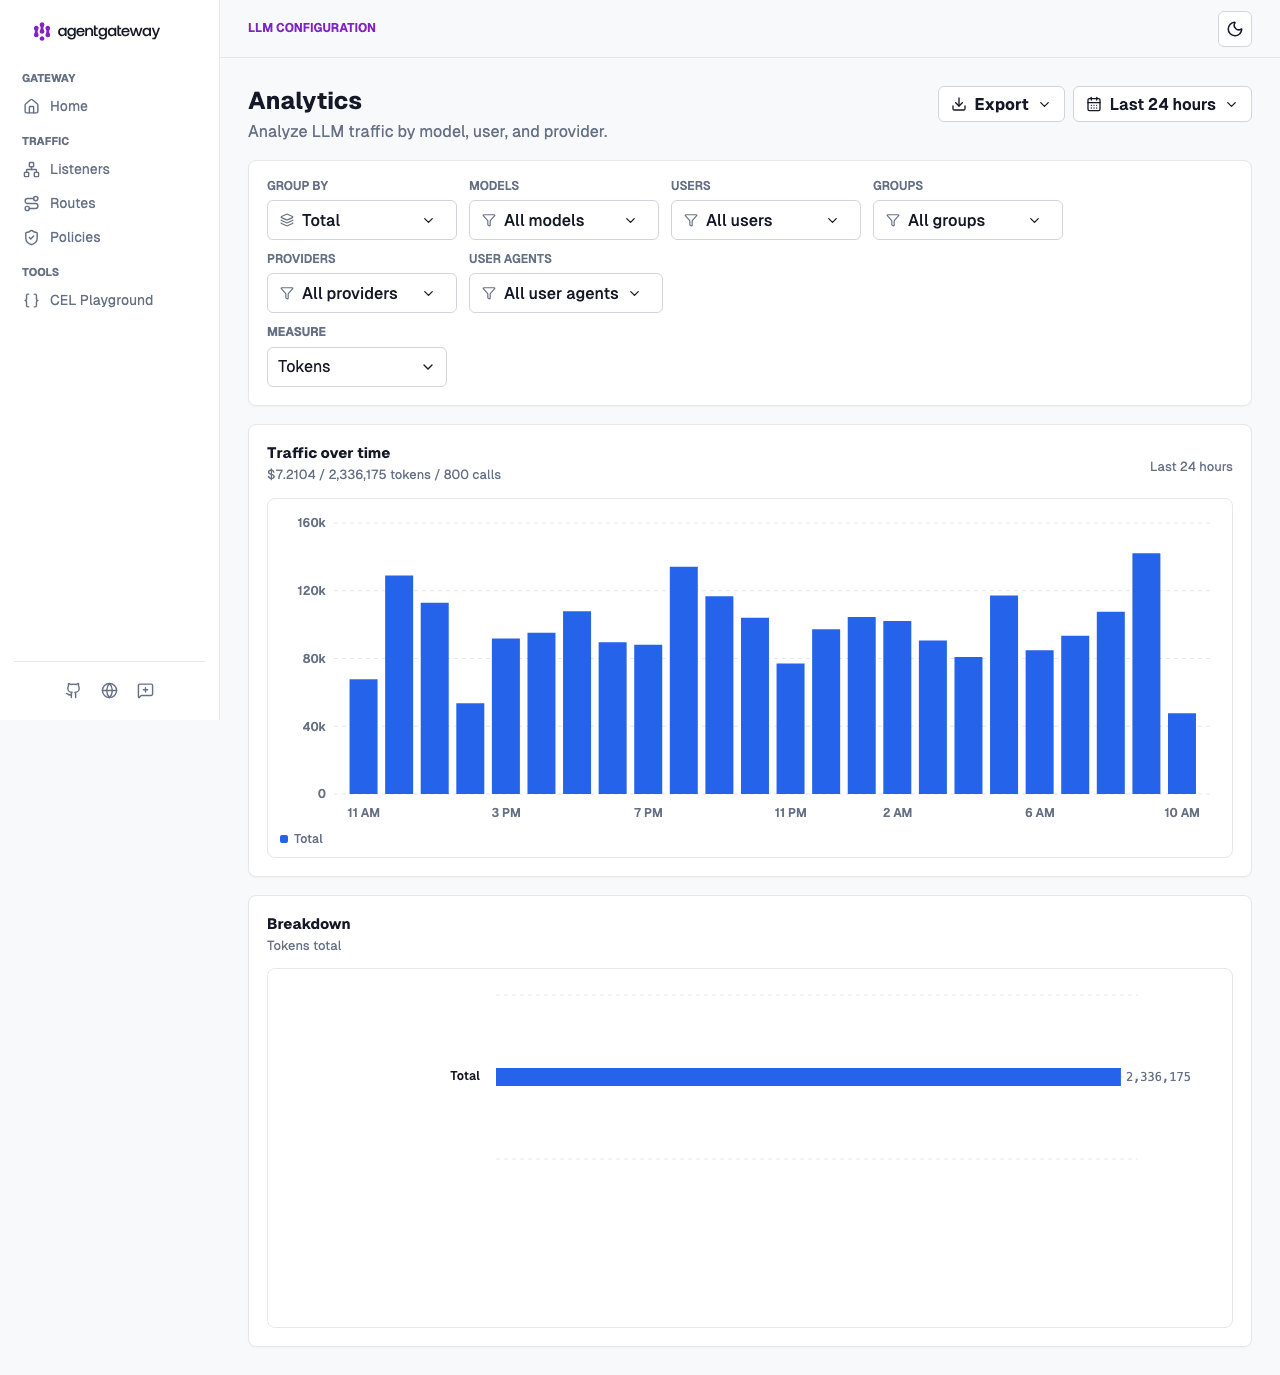
The built-in Admin UI includes a cost dashboard: the same LLM > Analytics page available in standalone mode. It plots spend, tokens, and calls over time, broken down by model, provider, user, group, or user agent. It works in Kubernetes too, but unlike standalone it is not enabled by default. The proxy ships without a request-log database, so the dashboard has nothing to show until you configure one.
Requirements
Two pieces of configuration power the dashboard:
- A request-log database (
config.database). The Kubernetes AgentgatewayParameters resource has no typed field for it, so you set it throughrawConfig, which merges raw agentgateway configuration into the proxy’s config file. Point it at a writable path in the pod, such as the/tmpvolume. - A model cost catalog (
spec.modelCatalog) so requests are priced. Without a catalog, the dashboard still shows token and call volume, but the cost is0.
/tmp path is an ephemeral emptyDir, so the request-log history is per-pod and is lost when the pod restarts or scales. For durable history, back config.database with a persistent volume, and note that each replica keeps its own local database.Enable the dashboard
Create (or update) a Gateway-level AgentgatewayParameters resource that enables the database through
rawConfigand attaches a model catalog. The catalogconfigMapmust already exist in the Gateway’s namespace (see Model costs).kubectl apply -f- <<EOF apiVersion: agentgateway.dev/v1alpha1 kind: AgentgatewayParameters metadata: name: cost-dashboard-params namespace: agentgateway-system spec: modelCatalog: sources: - configMap: name: my-model-costs key: catalog.json rawConfig: config: database: url: "sqlite:////tmp/data.db?mode=rwc" EOFAttach the AgentgatewayParameters resource to your Gateway with
infrastructure.parametersRef.modelCatalogandrawConfigare honored only on a Gateway-level resource.kubectl apply -f- <<EOF apiVersion: gateway.networking.k8s.io/v1 kind: Gateway metadata: name: agentgateway-proxy namespace: agentgateway-system spec: gatewayClassName: agentgateway infrastructure: parametersRef: name: cost-dashboard-params group: agentgateway.dev kind: AgentgatewayParameters listeners: - name: http port: 80 protocol: HTTP allowedRoutes: namespaces: from: All EOFWait for the proxy to roll out with the new configuration.
kubectl rollout status deployment/agentgateway-proxy -n agentgateway-system
Open the dashboard
Every request that flows through the proxy is now recorded and priced. Port-forward the proxy’s Admin UI and open the Analytics page.
Port-forward the Admin UI port.
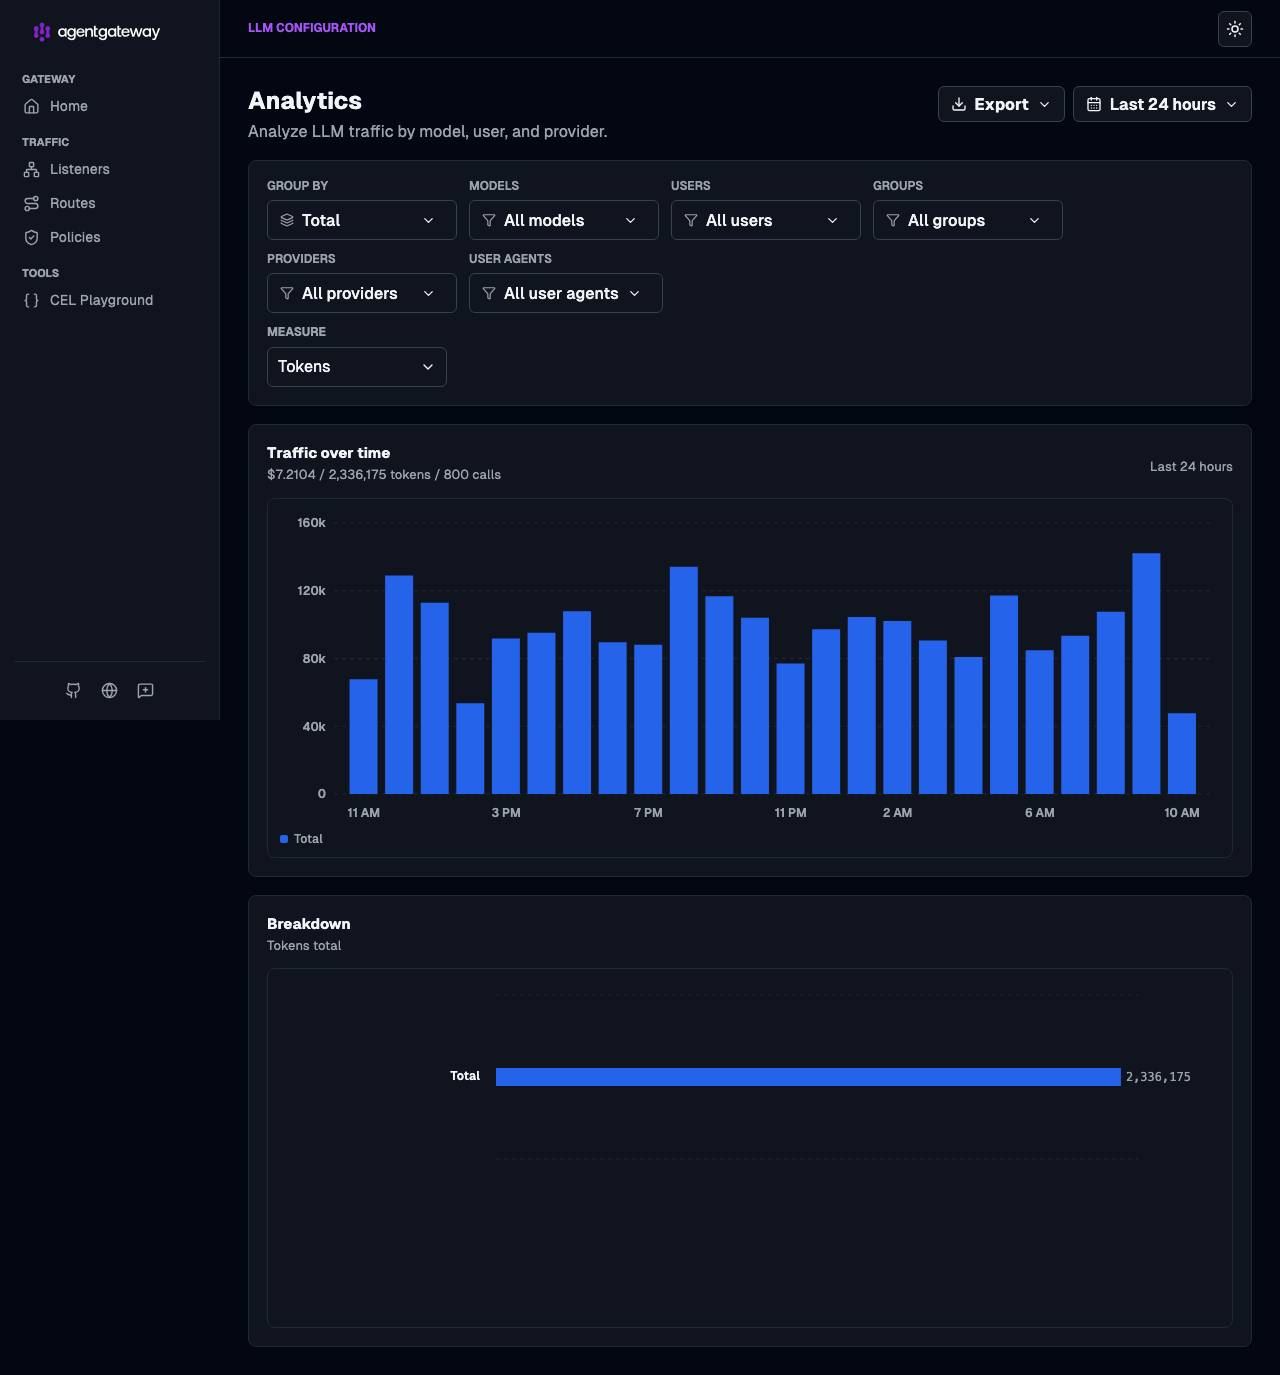
kubectl port-forward deployment/agentgateway-proxy -n agentgateway-system 15000Open http://localhost:15000/ui/llm/analytics. Send some LLM traffic through the gateway, then refresh to see traffic over time with a running tally of cost, tokens, and calls, plus a breakdown below the chart.
Group by and measure
Use the Group by control to break the same traffic down by model, provider, user, group, or user agent*, and toggle Measure between tokens, cost, and requests. Set to Cost to see realized spend in dollars. Use Export to pull the underlying numbers out for reporting.